← Home

Case study · Bondata

A redesign that made survey results easy to act on, and 1.7× more managers now do.

Bondata is an employee-engagement analytics platform for HR leads and managers in Finland. It turns pulse surveys into results across ~40 views and 25 chart types, so teams can see where engagement drops and set objectives to fix it.

My contribution
Discovery and research
Usability testing
Collaboration with stakeholders
Interface design and design system
Guidelines for development
Role
Lead designer
Team
3 designers
2 developers
The client's product owner
The client's founder
Industry
HR tech
Platform
Web app
Timeline
6 months

Goal

Raise the share of managers who set an objective within 14 days of a survey from 18% to 30%, within two survey rounds after launch. HR leads renew Bondata when their managers act on the results, so this was the number that mattered to the client.

Tracked alongside it

  1. 01

    A filtered result people can find and trust: task success and time on the baseline task

  2. 02

    An objective one step away from the result behind it: task success on the baseline task

  3. 03

    Fewer support tickets about filters, in equal periods before and after launch

  4. 04

    Overall usability: SUS on the same test

Results at a glance

  • Managers setting an objective within 14 days of a survey:

    18%to31% (+13 pp)

  • Task success, creating an objective from a result:

    3 of 8to8 of 8

  • Task success, finding a filtered result:

    4 of 8to7 of 8

  • Filter-related support tickets, three months before and after launch:

    33to12 (−64%)

  • Median time to find a filtered result:

    74 sto22 s (−70%)

  • SUS score:

    54to79 (+25 points)

Problem

Companies buy Bondata so that line managers act on their team's survey results, but only 18% set an objective after a survey closed. The results were hard to reach: filters were hidden in a collapsed side panel and did nothing until you pressed Refresh, and cards hid the one number that mattered. The goal was to raise that share to 30% within two survey rounds.

Research

I planned and ran the research: the support tickets and usage analytics first, then interviews and a baseline test on the old product. Another designer took notes in every session.

  • 214

    support tickets reviewed

    last six months, tagged by theme

  • ~40

    views in usage analytics

    plus 25 chart types

  • 8

    baseline test participants

    5 timed tasks and SUS

Also

  1. 01

    Interviews with 4 stakeholders: the product owner, the founder, support and sales

  2. 02

    In-depth interviews with 10 users from 5 client companies, 4 HR leads and 6 line managers, recruited through the client's customer success team

Key findings

  1. 01

    Managers open results once per survey, with about 15 minutes to answer one question: where did my team drop?

  2. 02

    Visits that went to the dashboard and the detailed results report

    82%
  3. 03

    Support tickets about filters

    31%

    Most of them said “the numbers didn’t change”

  4. 04

    Baseline participants who read a number from the previous filter setting

    2 of 8

    Without noticing: a confident wrong answer in an analytics product

  5. 05

    Managers didn’t set objectives because the objective page was disconnected from the result behind it: “I’d have to remember which question it was”

Source: usage analytics across ~40 views, 214 support tickets, baseline usability test (n = 8), user interviews (n = 10).

Ideation

  1. 01

    Two-day workshop I ran with the client's product owner, the founder and the dev team

  2. 02

    Review of filtering patterns in comparable analytics products

  3. 03

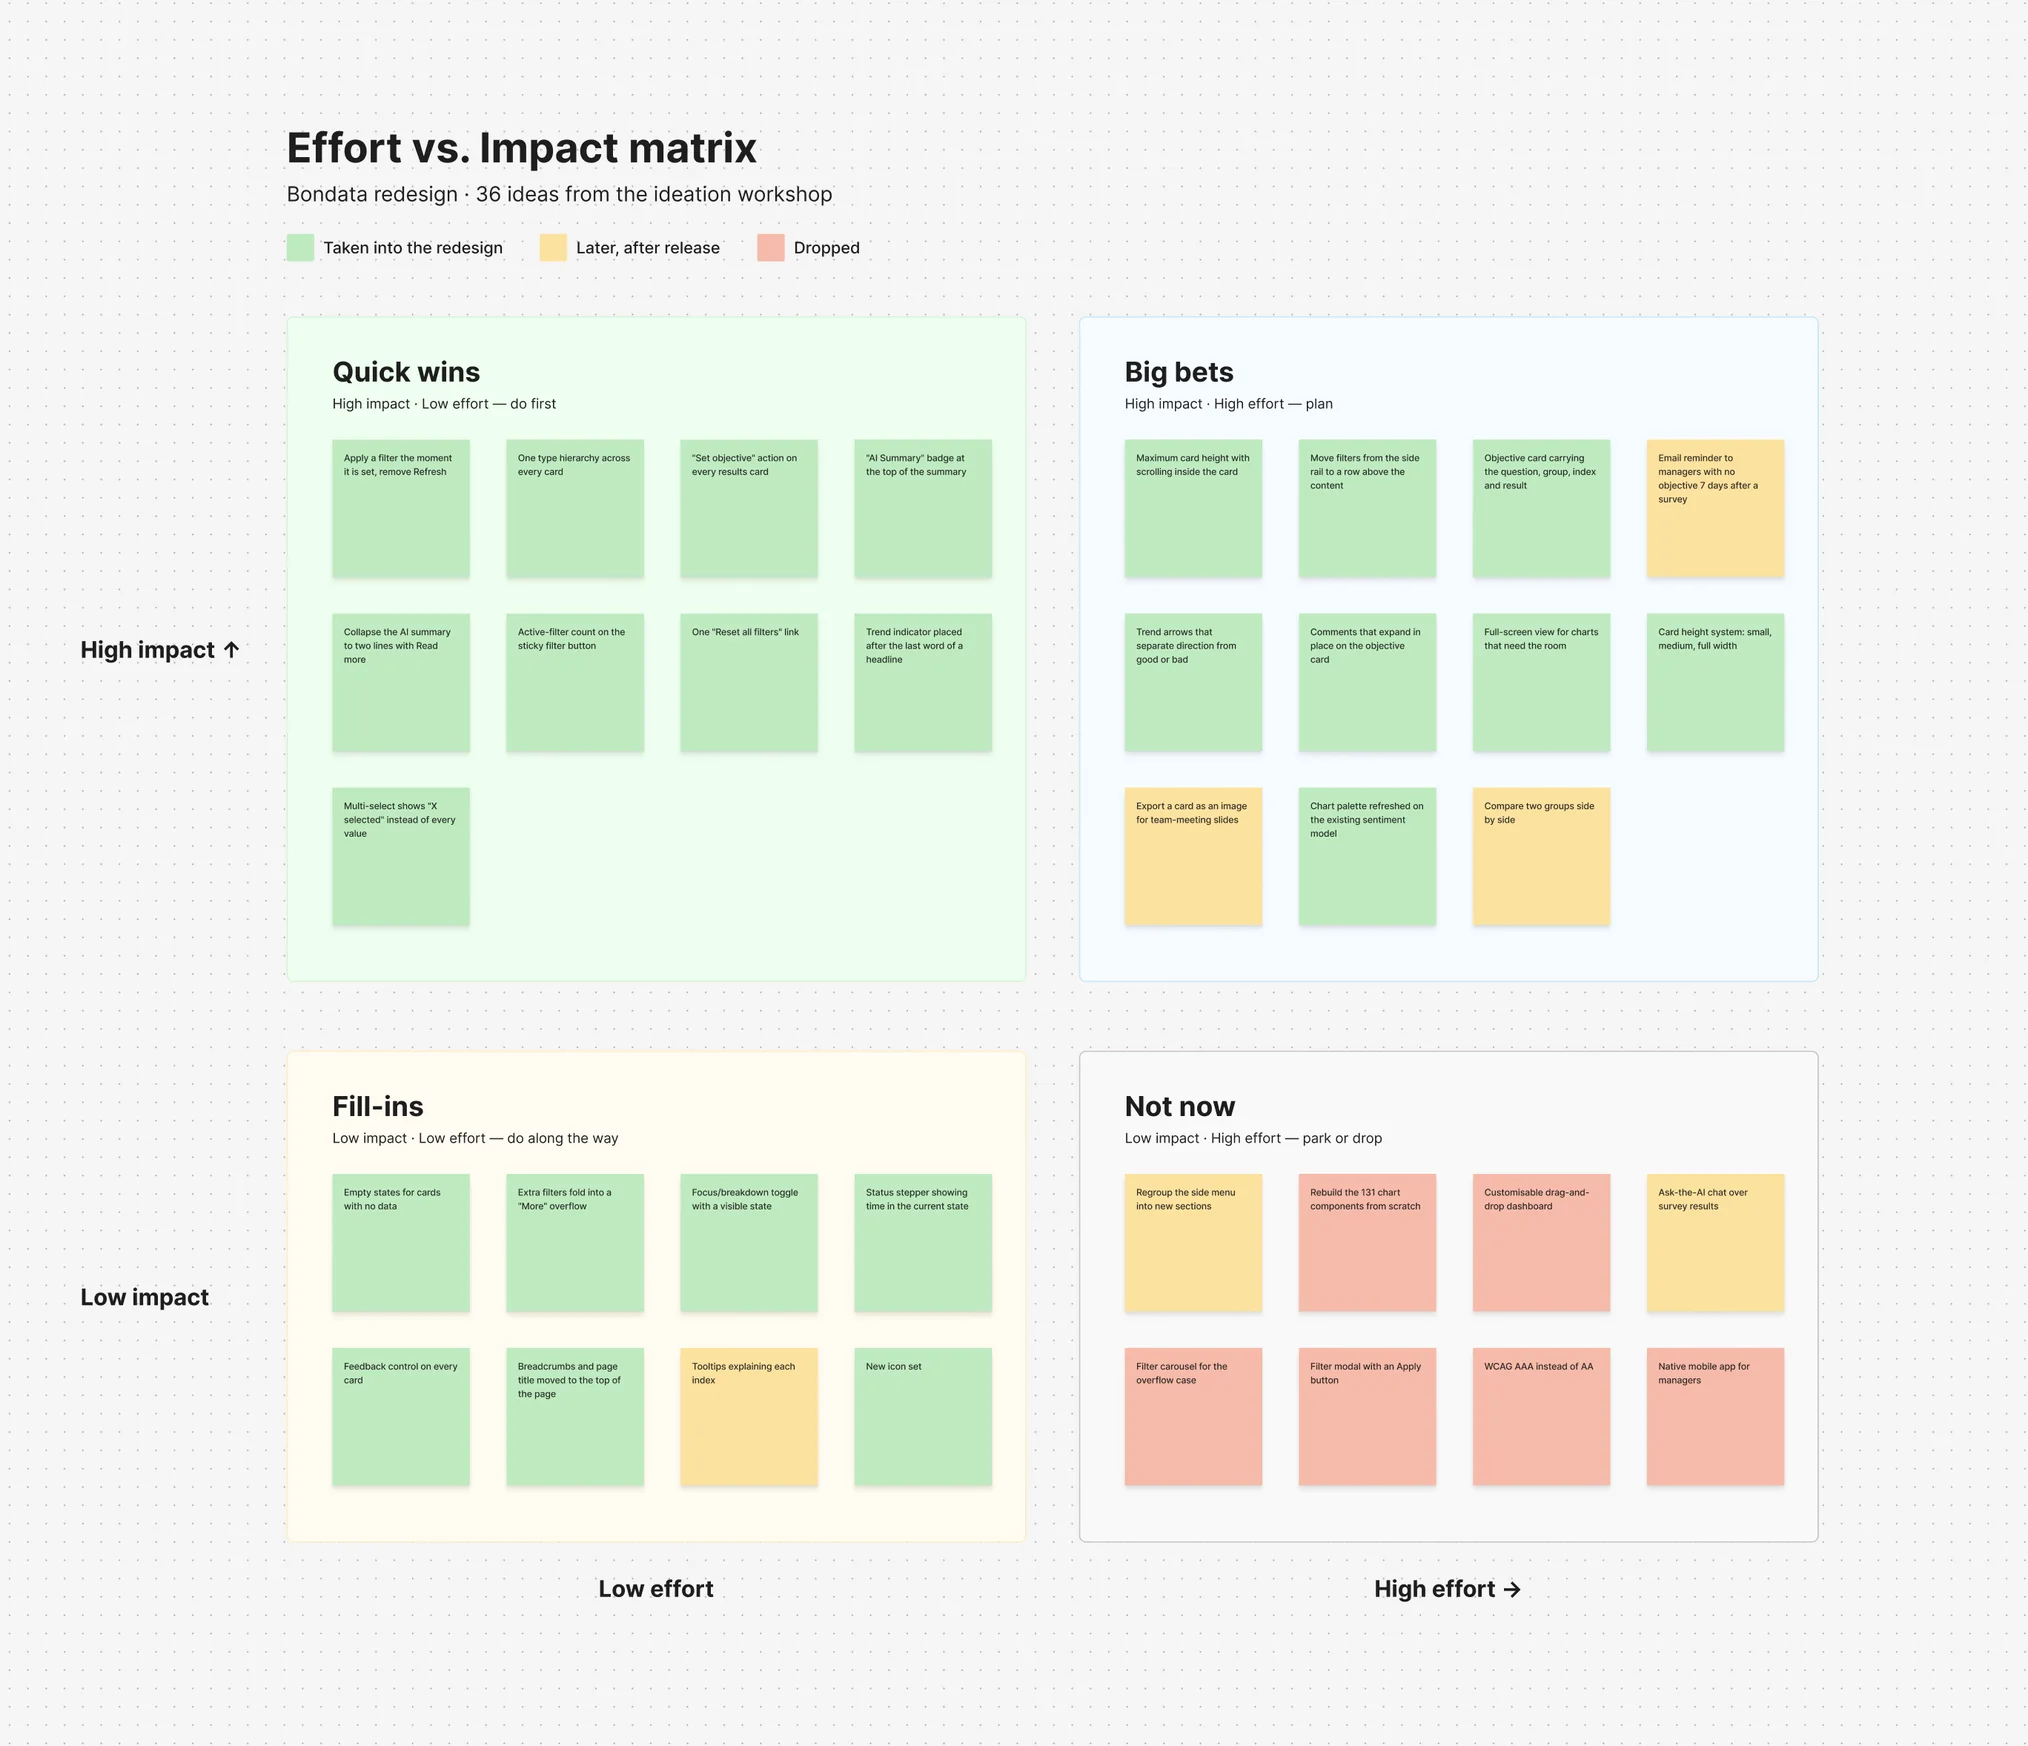
    Effort vs. Impact matrix to prioritise the 36 ideas from the workshop

Effort vs. Impact matrix: 36 ideas from the ideation workshop sorted into quick wins, big bets, fill-ins and not now
Effort vs. Impact matrix: 36 ideas from the two-day workshop, sorted into quick wins, big bets, fill-ins and not now.

The ideation phase helped identify key ideas for the next steps

  1. 01

    Moving filters above the content and applying them instantly

  2. 02

    Putting the survey result on the objective card, and a "Set objective" action on every results card

  3. 03

    A results summary a manager can scan in the 15 minutes before a team meeting, instead of reading it

  4. 04

    Marking AI summaries before they are read

Prototyping

I tested Figma prototypes with 8 people (3 HR leads, 5 managers) on the baseline's five tasks. Filters need real data, so I retested them on staging with a client's survey, again with 8 people. Task success and time in the results come from that round.

Design

I set the visual language and rebuilt the design system as a Material UI theme: 44 component sets, 136 colour variables, light and dark. Two designers applied it across part of the ~40 views under my review. Structure changed only where 82% of visits go: the dashboard and the results report. At twice-weekly client reviews I defended decisions with test results.

Decision 01

Filters were hidden and did nothing until Refresh

Before: find a collapsed side panel, open it, set up to 20 filters, press Refresh. Now filters sit in a row above the content and apply instantly. On scroll the row collapses into a sticky button; extra filters fold into "More".
Decision 02

An objective forgot the result that started it

The old card had a title, description and status, on a separate page. Now an objective carries its result: question, group, index, score and comments. "Set objective" on every results card turns a weak result into an objective without leaving the page.

Decision 03

The summary card had to be read, not scanned

The card was plain text at one size, benchmarks in brackets at line ends. Now response rate and comments are two figures on top, each strength and development area is a row led by its percentage with a green or red bar, and the benchmark is a tag. Downloads became links.

Decision 04

The AI summary didn't look like one

Three open paragraphs ended with "AI-generated summary may contain errors": you learned the source after reading. Now an "AI Summary" badge sits on top, the card wears the brand gradient no chart uses, and the text collapses to two lines behind "Read more".

Results

  • Managers setting an objective within 14 days of a survey:

    18%to31% (+13 pp)

  • Task success, creating an objective from a result:

    3 of 8to8 of 8

  • Task success, finding a filtered result:

    4 of 8to7 of 8

  • Filter-related support tickets, three months before and after launch:

    33to12 (−64%)

  • Median time to find a filtered result:

    74 sto22 s (−70%)

  • SUS score:

    54to79 (+25 points)

[ Other works ]

  1. 02

    Evoke

    Rebuilding an AI companion to earn trust and keep people coming back

    • Mobile app
    • Mental health

    Art direction for an AI companion that must not behave like one

    (view)

  2. 03

    Dishcover

    Designing a recipe app to make home cooking feel less like work

    • Mobile app
    • In development

    A culinary app with easy, step-by-step recipes for every taste

    (view)

  3. 04

    Your Vet

    Designing a vet marketplace to book a trusted vet in a few clicks

    • Web platform
    • Marketplace

    In progress